• Which the release of FS2020 we see an explosition of activity on the forun and of course we are very happy to see this. But having all questions about FS2020 in one forum becomes a bit messy. So therefore we would like to ask you all to use the following guidelines when posting your questions:

    • Tag FS2020 specific questions with the MSFS2020 tag.
    • Questions about making 3D assets can be posted in the 3D asset design forum. Either post them in the subforum of the modelling tool you use or in the general forum if they are general.
    • Questions about aircraft design can be posted in the Aircraft design forum
    • Questions about airport design can be posted in the FS2020 airport design forum. Once airport development tools have been updated for FS2020 you can post tool speciifc questions in the subforums of those tools as well of course.
    • Questions about terrain design can be posted in the FS2020 terrain design forum.
    • Questions about SimConnect can be posted in the SimConnect forum.

    Any other question that is not specific to an aspect of development or tool can be posted in the General chat forum.

    By following these guidelines we make sure that the forums remain easy to read for everybody and also that the right people can find your post to answer it.

Spikes when generating custom elevation BGL from QGIS

Messages
7
Country
belgium
Hello,

I'm building a cityscape for Antwerp, Belgium for P3D. I've been reading this forum for quite some time now and I want to thank you all for posting and answering a lot of questions over the years!

For some reason I wanted to get a realistic elevation as well so I set out to find a DEM on the regional government's geo website. I've found a 1 meter "digitaal terrein model" (DTM, digital terrain model) and a 1 meter "digitaal hoogtemodel" (Digital Height Model) but the latter supposedly includes the height of the buildings and trees etc so that's not what I'd want to use, I guess.

I'm currently faced with four problems with regards to the elevation model (don't worry, I have plenty of other questions w.r.t. the buildings
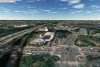
 :D):
  1. The river Scheldt is unrealistically low. Typically the quays are around 4-6 meters above water, not 20 meters. How do I fix that? I'm not sure how to inspect the data in QGIS.
  2. There are spikes in the resulting output. Is this a rasterization resolution issue when exporting from QGIS? (IIRC I used xDim and yDim for LOD18 as resolution to be used during export. I'm not sure if that's the way to go.) A sampling issue in the .inf? How can I smooth these out? It seems easier to just draws the desired elevation (I would be happy to basically drop the river and the ringway a few meters).
  3. The borders of the river and basin aren't that clean (cfr jagged lines) because of a misalignment between the photoreal and the DTM. How do I clean that up?
  4. From a performance point of view, would it be better to generate many smaller BGL's holding the terrain, or one big? (Currently I have a BGL for the photoreal and a BGL for the terrain.)
I've added my .inf file and two screenshots to illustrate the above problems.

Thank you,

Steven

[Source]
Type = GeoTIFF
Layer = Elevation
SourceDir = "D:\s_bee\Documents\flightsim\p3d_addon_scenery\Antwerp City\photoreal\"
SourceFile = "AntwerpTerrainVlaanderenv01.tif"
NullValue = 255,255,255
SamplingMethod = Gaussian
ulyMap = 51.223613273
ulxMap = 4.337971355
xDim = 5.343E-6
yDim = 5.343E-6

[Destination]
DestDir = "."
DestBaseFileName = "AntwerpTerrainVlaanderenv01"
DestFileType = BGL
LOD = 4,18
UseSourceDimensions = 1
CompressionQuality = 90


2019-9-21_23-55-52-976 (2).png
2019-9-21_23-59-51-491 (2).png
 
Messages
7,450
Country
us-illinois
Hi Steven:

To reply to all your questions above we need Geographic coordinates for the areas seen in your (2) screenshots above.

Please post either the on-screen Lat / Lon displayed by pressing <Shift>+<Z>, or attach a ZIP of saved flight *.FLT files.


Also, what is the source (ex: tileserver) for the photo-real imagery used in the screenshots above ?


What are the N-E-S-W Geographic coordinates for the full extent of the area you plan to include in your high resolution terrain mesh and custom photo-real imagery land class scenery package ?


NOTE: This is a large area, and the source data in numerous compressed ZIP files is extensive.

Do you have a link to a *.SHP file that lists what the extent of Geographic coverage is for each source *.ZIP file ?


GaryGB
 
Last edited:

arno

Administrator
Staff member
FSDevConf team
Resource contributor
Messages
32,883
Country
netherlands
Hi,

I would first inspect the source data in a tool like QGIS to see if you see the same elevation differences and spikes in there. That would help to narrow down where the issue is.
 
Messages
7
Country
belgium
Hi Gary and Arno,

sorry for the delay, I haven't had that much free time in the evening the past few days.

I've downloaded the data through QGIS using the GeoPunt Vlaanderen plugin for QGIS (link).

It's this source: https://geoservices.informatievlaan...ormat=image/png&styles=default&crs=EPSG:31370 ("Digitaal Hoogtemodel Vlaanderen II, digitaal terreinmodel 1m") .

Approximated coordinates for the area I used (I didn't write them down :( ) upper left corner N51.2245 E4.3510 and lower right corner N51.1831 E4.4215.

This is what the DTM looks like in QGIS:

1569957535473.png


If I zoom in to the area visible in the second screenshot of my first post then we see the L shaped basin to the left (top middle right in my second screenshot) and in the center some kind of peak:

1569957675108.png


L shaped basin:

1569957735942.png


Peak:

1569957911468.png


I'm afraid it's either due to the export (I used the LOD18 value as resolution for the export, same values as I put in the .inf file which I've shared in my first post) or perhaps a tesselation setting in the simulator?
 
Messages
7,450
Country
us-illinois
Hi Steven:

The "spike" is likely a LiDAR classification / filtering anomaly from an apparent metal duct on a building at the rear of a Olympic Facility at Wezenberg, which can be fixed with a small CVX vector flatten in FS. :scratchch

Normally GIS software will eliminate all but the ground itself from raw LiDAR data if creating a "bare Earth" DTM.


Via this web page:

https://www.google.com/earth/versions/#earth-pro


...you can download Google Earth Pro Desktop Edition to use for various purposes when creating FS scenery:

https://www.google.com/earth/versions/


Once that is installed, download the attached Google Earth *.KMZ file, un-ZIP and double-click it to open a 3D view of the site in question ...within Google Earth. ;)


IIUC, the *.SHP files I asked about, and other LiDAR data are all inside ZIP archives downloadable here: :pushpin:

https://translate.googleusercontent.com/translate_c?depth=1&hl=en&prev=search&rurl=translate.google.com&sl=nl&sp=nmt4&u=http://www.geopunt.be/download?container=dhm-vlaanderen-ii-dtm-raster-1m&title=Digitaal%20Hoogtemodel%20Vlaanderen%20II,%20DTM,%20raster,%201m&xid=17259,15700019,15700186,15700191,15700256,15700259,15700262,15700265&usg=ALkJrhh3YXbXon8vfKBDo6P6cHcZAde1JA


The LiDAR ZIP archive file name to be downloaded can be determined from this locator map:

https://overheid.vlaanderen.be/sites/default/files/media/Digitale overheid/DHM/Opdrachtzones DHM-Vlaanderen II_2.jpg


I can reply further tomorrow after data download is done, as this area of Antwerp is (4) 1-GB ZIP files: :coffee:

DHMVIIDTMRAS1m_k07.zip (1 GB)
DHMVIIDTMRAS1m_k08.zip (1 GB)

DHMVIIDTMRAS1m_k15.zip (1 GB)
DHMVIIDTMRAS1m_k16.zip (1 GB)

GaryGB
 

Attachments

  • Wezenberg_LiDAR_Spike_Source_GE_KMZ.zip
    645 bytes · Views: 148
Last edited:

arno

Administrator
Staff member
FSDevConf team
Resource contributor
Messages
32,883
Country
netherlands
Hi Steven,

I'll try to have a look at the data when I get home tonight.
 
Messages
7,450
Country
us-illinois
Hi again:

After opening the only (1) of the (4) ZIP files cited above that completed its download, it is apparent from the location of DHMVIIDTMRAS1m_k07.zip, that the actual file of interest for the specific area in question is:

DHMVIIDTMRAS1m_k15.zip (1 GB)

Based on Global Mapper auto-detection of 'Initial load' GIS cartographic projection format from the GeoTIFF, the GIS format required will be (EPSG:31300) for both *.TIF and *.SHP files.

The online Metadata states a somewhat different projection of (EPSG:31370):

https://translate.googleusercontent.com/translate_c?depth=1&hl=en&prev=search&rurl=translate.google.com&sl=nl&sp=nmt4&u=https://download.vlaanderen.be/Producten/GetDocument?id=291&title=Leesmij_DHMVII_pdf&x=Leesmij_DHMVII_pdf&xid=17259,15700019,15700186,15700191,15700256,15700259,15700262,15700265&usg=ALkJrhge2Zc80bXrbEVs4Jz6CZBkuEICfw#4


Assuming that latter download completes successfully, there will be more info available later.

[EDITED]

OK, so the DHMVIIDTMRAS1m_k15.zip Flanders DTM data set has numerous visible anomalies. :oops:

Global Mapper 3D mode images using ArcGIS World Imagery texture-mapped to Flanders' DTM follow below.


The "spike" is definitely a LiDAR classification / filtering anomaly from a number of variable density and sloped structures involving a 'berm' and trees surrounding the Olympic Swimming Facility and Radio / University buildings at Wezenberg, which might best be fixed with CVX vector 'sloped' flatten polygons in FS. :scratchch


antwerp_wezenberg_lidar_anomaly_gm_world_imagery_3d_a-jpg.51954


antwerp_wezenberg_lidar_anomaly_gm_world_imagery_3d_b-jpg.51955


Global Mapper 3D mode images using ArcGIS World Imagery texture-mapped to Flanders' DSM (WCS data)

antwerp_wezenberg_lidar_anomaly_gm_world_imagery_3d_dsm_a-jpg.51958


antwerp_wezenberg_lidar_anomaly_gm_world_imagery_3d_dsm_b-jpg.51959


The elevation of shorelines / water areas are variable in this DTM data set, which might also best be fixed with CVX vector 'sloped' flatten polygons in FS.

antwerp_galgenweel_scheldt_river_lidar_anomaly_gm_world_imagery_3d-jpg.51951


FYI: Normally GIS LiDAR software will eliminate all but the ground itself from raw LiDAR data if creating a "bare Earth" DTM, but in some cases a combination of structures with varying elevation, slope, density and/or translucency, when in close proximity to one another ...may effectively prove more than software algorithms can process accurately.

The resulting anomalies may subsequently be retained in a DTM data set that has not been well-vetted.

One may find that correction for elevations and creation of less objectionably aliased edges between shorelines and water texture / hydro polygon areas may be easier to achieve by using CVX vector sloped flatten polygons compiled with SDK SHP2VEC, and custom photo-real imagery land class compiled via SDK Resample that utilizes both Blend Masks and Land-Water Masks.

To learn procedures to make more accurate scenery in local FS world areas using ex: SBuilderX, you may wish to review this tutorial: :teacher:

Terrain Design

sendfile.php

File Description:
Terrain Design for Flight Simulator X

This simple illustrated document explains the basic concepts in Flight Simulator X terrain, and how to change them using SBuilder for FS X. Make new water bodies, roads, vehicle traffic, airport flattens, remove autogen, add more detail - anybody can do it easily and quickly.
My most sincere apologies - I am unable, for lack of free time, to offer support of any kind. For questions or problems, please post in the Avsim scenery design forum.

Filename: terrain_design_for_flight_simulator_x.zip
License: Freeware
Added: 14th December 2009, 13:29:15
Downloads: 16648
Author: Luis Feliz-Tirado
Size: 3991kb

https://library.avsim.net/esearch.php?CatID=fsxsd&DLID=141643


To make more accurate FS scenery, you are likely to also encounter these topics at some point as well:

Make photo-real ground textures

sendfile.php

File Description:
It is very easy to create your very own high-resolution, custom (photo-real) ground textures. This document explains the concepts and techniques and illustrates the use of SBuilderX with which you can quickly and easily download aerial images and make this type of scenery. So, why hesitate? Make Flight Simulator scenery as real as it gets! Very sorry - no support of any kind is offered. Please do not write. For any questions, please post in the Avsim Scenery Design Forum.

Filename: make_photo-real_ground_textures_in_fs_x.zip
License: Freeware
Added: 21st November 2009, 23:20:06
Downloads: 17714
Author: Luis Feliz-Tirado
Size: 2143kb

https://library.avsim.net/esearch.php?CatID=fsxsd&DLID=140539


Using the Autogen Annotator

sendfile.php

File Description:
The Autogen Annotator is a powerful tool for modifying the autogen of default ground textures or adding autogen to custom (photo-real) ground. This document illustrates the use of the tool, and includes a pictorial guide to all autogen object types. Very sorry - no support of any kind is offered. Please do not write. For any questions, please post in the Avsim Scenery Design Forum.

Filename: using_the_autogen_annotator_264833.zip
License: Freeware
Added: 21st November 2009, 16:18:51
Downloads: 4220
Author: Luis Feliz-Tirado
Size: 8930kb

https://library.avsim.net/esearch.php?CatID=fsxsd&DLID=140537


You may also wish to consider using Arno's ScenProc utility to 'semi-automatically' create this scenery: :wizard:

https://www.fsdeveloper.com/forum/forums/scenproc.131/


BTW: ScenProc has a number of features that can utilize ex: OpenStreetMap data for creating scenery.


You may be able to use additional Flanders GIS data on the website to create parts of your scenery: ;)

https://translate.googleusercontent...700271&usg=ALkJrhiOSHyq2vr7BsPsHh1G4o_bgX3HrA


https://translate.googleusercontent.com/translate_c?depth=1&hl=en&prev=search&rurl=translate.google.com&sl=nl&sp=nmt4&u=https://download.vlaanderen.be/Producten/Detail?id=1&title=GRBgis&xid=17259,15700019,15700186,15700191,15700256,15700259,15700262,15700265,15700271&usg=ALkJrhi7g0MRcybtPd0xvVkd11I1GsRxFg

https://translate.googleusercontent.com/translate_c?depth=1&hl=en&prev=search&rurl=translate.google.com&sl=nl&sp=nmt4&u=https://download.vlaanderen.be/Producten/Detail?id=131&title=GRBcad&xid=17259,15700019,15700186,15700191,15700256,15700259,15700262,15700265,15700271&usg=ALkJrhjmQLvC5NxtDUJI4qKuUlJqvC5nbw

https://translate.googleusercontent...700271&usg=ALkJrhjw64KhC4612DuPBOov9HTHOczJ9g


PS: Although I personally enjoy having a lot of terrain detail when I do 'low-and-slow' flights over my own custom scenery in FS, the amount of elevation data you will have to work with at 1 Meter resolution for Antwerp is extremely massive. :yikes:

I respectfully suggest that it would be impractical to produce and distribute this scenery project at 1 Meter resolution via a download as a commercial or shareware package. :alert:

Considering the methods you may need to utilize for cleaning this data set for use in scenery production, you may find that use of a lower ex: 5 Meter DTM may make this project (somewhat) more manageable. :idea:


If you do prefer to create a version of this scenery using 1 Meter resolution elevation data, and you want to see how much the edges of CVX vector objects can be rendered in P3D without as much aliasing, you can enable a higher resolution terrain grid independently from that provided via the internal resolution of a terrain mesh BGL either by setting P3D GUI Terrain Mesh Resolution slider to 1 Meter, or by editing parameter values in the 'active' Prepar3D.Cfg file.

I recommend P3D GUI Tessellation slider be set to a max. Right position for max. terrain rendering precision:

* Tessellation Factor (aka "Terrain Mesh Complexity" in MSFS) at 100 %


If you wish, you can enable an even higher resolution terrain grid independently from that provided via the internal resolution of a terrain mesh BGL; this will create more closely-spaced grid vertices onto which vector objects and terrain mesh data can be displayed with less aliasing (...as a function of the FS rendering engine quad 'tile' infrastructure).

Assuming you have a DX-11 video card, in Prepar3D.Cfg, you may wish to test:

[TERRAIN]
LOD_RADIUS=3.500000
TESSELLATION_FACTOR=100 ; Tessellation Factor is aka "Terrain Mesh Complexity" in MSFS2Kx
MESH_RESOLUTION=25 ; 25 = 1.2 M, 26 = 60 cm, 27 = 30 cm, 28 = 15 cm, 29 = 7.5 cm, 30 = 3.75 cm
TEXTURE_RESOLUTION=30

See: https://www.fsdeveloper.com/forum/threads/flattens.425495/post-633002

If you do not have a DX-11 video card, and you have a problem displaying Hi-Res mesh in P3D, let us know.


Hope this helps as an initial overview of your options as you consider how to proceed with this project. :)

[END_EDIT]

GaryGB
 

Attachments

  • Antwerp_Galgenweel_Scheldt_River_LiDAR_Anomaly_GM_World_Imagery_3D.jpg
    Antwerp_Galgenweel_Scheldt_River_LiDAR_Anomaly_GM_World_Imagery_3D.jpg
    257.6 KB · Views: 502
  • Antwerp_Wezenberg_LiDAR_Anomaly_GM_World_Imagery_3D_a.jpg
    Antwerp_Wezenberg_LiDAR_Anomaly_GM_World_Imagery_3D_a.jpg
    246.1 KB · Views: 522
  • Antwerp_Wezenberg_LiDAR_Anomaly_GM_World_Imagery_3D_b.jpg
    Antwerp_Wezenberg_LiDAR_Anomaly_GM_World_Imagery_3D_b.jpg
    270.3 KB · Views: 480
  • Antwerp_Wezenberg_LiDAR_Anomaly_GM_World_Imagery_3D_DSM_a.jpg
    Antwerp_Wezenberg_LiDAR_Anomaly_GM_World_Imagery_3D_DSM_a.jpg
    233.8 KB · Views: 508
  • Antwerp_Wezenberg_LiDAR_Anomaly_GM_World_Imagery_3D_DSM_b.jpg
    Antwerp_Wezenberg_LiDAR_Anomaly_GM_World_Imagery_3D_DSM_b.jpg
    317.4 KB · Views: 507
Last edited:

arno

Administrator
Staff member
FSDevConf team
Resource contributor
Messages
32,883
Country
netherlands
Hi Steven,

I had a look at the data sources in QGIS. One thing I noticed is that a WMS and WCS version is offered, which one did you download? I would advice you to try the WCS version and not the WMS one. In WMS you get a color image of the elevation data, not the actual elevation values. That could introduce some artifacts.

When I look at the WCS data I do see some artifacts, mainly in the water, so that can give some spikes. But in general the data looks quite nice. The river doesn't seem to have an elevation that is 20 meters different from the land either.

I might try to do a quick resample here as well.
 

arno

Administrator
Staff member
FSDevConf team
Resource contributor
Messages
32,883
Country
netherlands
As a quick test I turn a part of Antwerp into a scenery as well. The screenshot below is from the same area you did. Looks quite good to me, so I think the data is good. I downloaded from the WCS.

1570128745157.png


1570128948641.png
 
Messages
7
Country
belgium
Hi Gary and Arno,

thanks for looking into this! Your experience built up over the years really shows!

I'll have to read up on the flattens (and pretty much everything else!) so that'll be something for the next few weekends (busy work weeks ahead). Arno's WCS screenshot looks pretty good! I've downloaded through their GeoPunt Vlaanderen QGIS plugin so I'm not really sure but I see "wms" in the URL's of the layers I currently have in the project.

I do have one question still: what value am I supposed to put into QGIS' export for the X and Y resolution? The QGIS documentation isn't really clear on what measurement unit it is supposedly expressed. Is it the inverse of the One Pixel (Degrees) column in the QMID/LOD table found in the SDK over here ?
 

arno

Administrator
Staff member
FSDevConf team
Resource contributor
Messages
32,883
Country
netherlands
I entered the amount of degrees per pixel when I downloaded the data in QGIS indeed. So that would be the column from the table you mentioned. Be aware that the values in the SDK are rounded and not very accurate.
 
Messages
7,450
Country
us-illinois
Hi Steven:

It is important to distinguish GeoPunt data downloaded via WCS vs. WMS access methods ...as Arno stated:

https://www.fsdeveloper.com/forum/t...om-elevation-bgl-from-qgis.446133/post-830474

Hi Steven,

I had a look at the data sources in QGIS. One thing I noticed is that a WMS and WCS version is offered, which one did you download?

I would advise you to try the WCS version and not the WMS one. In WMS you get a color image of the elevation data, not the actual elevation values. That could introduce some artifacts.

When I look at the WCS data I do see some artifacts, mainly in the water, so that can give some spikes. But in general the data looks quite nice. The river doesn't seem to have an elevation that is 20 meters different from the land either.

I might try to do a quick resample here as well.


In ex: Global Mapper, WCS downloaded a local file of elevation data, and automatically loaded it.

The WMS method downloaded and displayed what is essentially an "image" of what the elevation looks like when displayed in the workspace of a GIS application with a HillShader attribute applied, and is not ready-to-use elevation data, nor does that "image" have the same detail as an actual elevation data set.

When one has loaded an actual elevation data set, if the Mouse cursor is moved over the work-space, one should be able to read changing elevation data values somewhere within a GIS application work-space.

This is why I would recommend just downloading all required files for the full extent of your project area:

Hi Steven:
https://www.fsdeveloper.com/forum/t...om-elevation-bgl-from-qgis.446133/post-830435

IIUC, the *.SHP files I asked about, and other LiDAR data are all inside ZIP archives downloadable here: :pushpin:

https://translate.googleusercontent.com/translate_c?depth=1&hl=en&prev=search&rurl=translate.google.com&sl=nl&sp=nmt4&u=http://www.geopunt.be/download?container=dhm-vlaanderen-ii-dtm-raster-1m&title=Digitaal%20Hoogtemodel%20Vlaanderen%20II,%20DTM,%20raster,%201m&xid=17259,15700019,15700186,15700191,15700256,15700259,15700262,15700265&usg=ALkJrhh3YXbXon8vfKBDo6P6cHcZAde1JA


The LiDAR ZIP archive file name to be downloaded can be determined from this locator map:

https://overheid.vlaanderen.be/sites/default/files/media/Digitale overheid/DHM/Opdrachtzones DHM-Vlaanderen II_2.jpg


I can reply further tomorrow after data download is done, as this area of Antwerp is ~(4) 1-GB ZIP files: :coffee:

DHMVIIDTMRAS1m_k07.zip (1 GB)
DHMVIIDTMRAS1m_k08.zip (1 GB)

DHMVIIDTMRAS1m_k15.zip (1 GB)
DHMVIIDTMRAS1m_k16.zip (1 GB)


BTW: SDK Resample requires source data to be projected in (EPSG:4326), and pixel dimensions are expressed in fractional Arc Degrees per pixel.

IMHO, the 'easiest' source file format to use with SDK Resample, is GeoTIFF format.

GeoTIFF format may be submitted to SDK Resample with a much simpler *.INF file; Resample will then internally read the GeoTIFF and companion files ...to derive all parameter values it needs to compile a BGL.

Hope this helps a bit more. :)

GaryGB
 
Top