- Messages
- 17
- Country

I'm about to knit this new XML sweater with a needle... Let's call it a fuel gauge. I've worn out far too many old threads and the now vintage FS2X tutorials which leaves some things to be desired in the way of full explanations so I will attempt to provide some here to help future proof while also posing some questions to ponder in hopes of generating some discussions.
Currently, I'm a little confused about XML needle points and what to use, particularly when you have a needle that may need to point West or North (or really anything other than East and also anything that requires counter-clockwise movement). I see many gauges that seem to only use "PointsTo=East" for everything and nothing else which adds to the confusion when there are three other directions available and seemingly should be in use much more from a more intuitive standpoint. I would also think west pointing needles which move clockwise would actually be most common but I haven't found many. So I'm wondering why is that? Is overuse of East pointing needles and the PointsTo=East command just an "easy way out" coding habit that works for a lot of directions simply because it's what people have copied from one another over the last 20 years or are there actually more "proper" ways to do these things? Why don't I ever see the other 3 cardinal directions in use with their coding reflecting that use!?
I'm hoping to get to the bottom of this once and for all as I have only found 4 or 5 older threads and while they give some code examples the main issue for me is none of them ever teach the HOWs and WHYs to allow you to really understand the full process of needle pointing. Every time I come back to it I quickly glaze over staring at code examples, especially when I can't mentally connect the how and why something works in one way but not another that seems so similar. I want to also preface this by saying this theory that I'm about to dive into might not be status quo or fully correct, but I think it is and I think you are going to easily see what I'm getting at and how this should actually be intuitive in its application.
I also get that the coding in the nonlinearity table always reflects clockwise movement and that the table can be reversed to change things or change direction but that is not my only issue and I really want to take a logical stab at analyzing this from the top down.
So let's begin;
As I understand it, you should first create a needle bitmap graphic in whatever physical orientation that will most closely reflect its intended movement. That would of course make the most logical sense. However, I often see many gauges where people DO NOT do this which I can only assume is to save a little time and use just one needle image per gauge instead of two, or three or more. The issue with that for me is it becomes very confusing when trying to learn to code. Regardless, if using more than one needle for purposes of better coding, and for better purposes of intuition and illustration, I have to assume that if doing so, you would also want the PointsTo= command variable to reflect that same exact orientation. Thus any vertical graphic with the needle point set on top (0 degrees / north) should intuitively be created for a needle that when in use will mainly point up and would primarily use some portion of the top semi-circle of a gauge dial. And so in this case you would similarly intend to use a PointsTo=North command in the XML code. (see the included drawing example I made to follow along). I think I've read elsewhere that this is how to start.
As as example, a north pointing needle may have its Nonlinearity table set to start on the left side of a gauge, let's say 270 degrees left (for zero percent fuel or zero gallons, zero amps, etc) and then end at 90 degrees right (for 100 percent fuel or x-full gallons, etc) I would assume that you would want to use a needle graphic and "PointsTo" that is always somewhere in between your two extremes and not fully to one side or the other. Even though I suppose it could work I don't think it would make sense to use one extreme or the other (such as east or west) Regardless, if just using an East needle graphic for everything then assumably you could also just use a West facing needle graphic too for the same purpose.
Once again, it seems a lot of coders often use East exclusively and so I just want to know why that is unless all gauges typically tend to be able to use that assignment. As I discuss below, West and North needles are intuitively more cumbersome to figure out, but if we can demystify their use then maybe it will no longer appear that way for myself and others who are now looking towards the longer term of FS gauge coding now that we have a new sim this year. Regardless, and in efforts of common sense and intuition, you would think you would always want to use one that best represents your midpoint between the two value range extremes and never one that is on either extreme or very close to it. Regardless, after reading various posts on this topic, many of which go unanswered, this topic seems to be something most people struggle with. I made a graphic that is attached which you can follow along with.
So let's assume the following four things are most often true for the 4 possible needle orientations of North, ..South, ..East or ..West:
A -- a vertical (North) pointing needle will most likely need to sweep from approximately 270 degrees left or west to 90 right or east in a CLOCKWISE fashion, thus fully sweeping left to right like the speedometer in your car.
B -- a South pointing needle would need to do the same from 270 left to 90 right but in a COUNTER-clockwise direction sweeping at the bottom of a semi-circular arc moving left to right. (I assume this is a rare use in FS)
C -- an East pointing needle would generally sweep up from 180 degrees south (for empty, off, zero fuel, etc,) to 0 north (full, on, 100%, etc) thus moving in a COUNTER-clockwise direction.
D -- a West pointing needle would need to visually point west and sweeps from 180 degrees south to 0 north in a CLOCKWISE direction like a North needle does.
So in these four scenarios, we have two needles (A-North and D-West) that move CLOCKWISE and two needles (B-South and C-East )that move in a COUNTER-clockwise direction. I think these are the only four possibilities you will ever encounter.
They all overlap each other of course (90 degrees each side of their cardinal heading) but if you mentally assign each one a 180-degree arc movement then this all makes for logical illustration as to which is best to use for your coding needs.
*Note: A caveat here is this is not (yet) discussing needle movements which may require full 360 rotation like an Altimeter, Airspeed Indicator, ADF, RMI, etc... only gauge needles with a limited sweep of 220 degrees or less and most commonly 180 or less.
Based on those four assumptions I assume most everyone will have the greatest troubles understanding the next two scenarios below because of their non-intuitive positioning (Position=) in relation to the axis of rotation <Axis X= Y= />.
For this example; Let's say you have a needle that when the graphic is drawn East or West both are X=50 Y=25. And when the graphic is drawn vertically for a North or South orientation the values are both now X=25 and Y=50 (thus opposite).
So the big difference here between all four is their Position= values (i.e; coordinates). These will all be very different if you always have to position and reference each one of them from the Top Left corner of the graphic bitmap.
Now let's look at the two which are most confusing and least intuitive;
Scenario 1 -- A West needle. -- If you have a needle that needs to primarily face west and sweeps from "0/empty" at 180 deg. south up to 0 deg. north, how is it coded using a bitmap that is also graphically drawn pointing west???
Scenario 2 -- A North needle. -- If you have a needle that needs to primarily face north and sweeps from "0/empty" from a 270 west position a to 90 degrees east. How is it coded using a bitmap that is also graphically drawn pointing north???
Why these two particular scenarios are much more confusing than an East or South needle is because if you must always use the top left corner of the needle bitmap for its Position= coordinates in relation to the main bitmap it sits on, it means the axis of rotation for these two needles in particular will always be on the far opposite end from where you are anchoring them with the Position=. So this means the Position point and axis point are on far opposite ends from one another and in turn requires a lot more "careful math" to properly calculate and place the axis reference point of these two needle types. What may have been only counting 15 or 20 pixels with an East or South needle may become 50 to 60 or more with a North or West needle.
So with these two scenarios in particular it means the Axis' X value for needle rotation is now calculated at much longer of a distance away from the needle point than would be for any East or South pointing needle because with East / South the axis is always set much closer to the anchoring Position= point of the graphic. This is why I think people probably tend to just use East needles a lot. And here is where I'm even more confused is I swear I've seen instances of East, West, and North needles in use and the gauge works but the axis values are all the exact same... like X=10, Y=13 for example. I don't know how or why it works because it just doesn't make any sense. Logically speaking, and as I've just went to lengths to illustrate and explain, West and North needles should have a much greater axial X distance for horizontally drawn West needle bitmaps and a taller or longer axial Y distance for vertically drawn North needle bitmaps and the Axis section should always reflect that. Am I somehow wrong with this assumption? I don't think so but again, this is a head-scratcher that I haven't nailed down yet. I'll amend this document once I do.
If we assumed the two scenarios above are true then it will always mean any East and South needles (again.. both drawn that way and intentionally used and or positioned that way) will always have much smaller Axis X/Y values than any West or North needles because the axis points of all East / South needles will always be much closer to the point of orientation for the top left Position = coordinates and are therefore much easier to calculate very quickly. Again, this is my hunch why you see PointsTo=east with east drawn needles being used more than anything else.
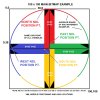
Now let's look at a visual scenario of all these examples and explore how the above two West and North scenarios are coded, as well the two East and South that could be considered more common. (See attached image)
Given a base background bitmap of 100 x 100 with a central axis rotation point of 50,50 and a needle bitmap for all four cardinal headings with a size of X= 50 Y= 25 (or X= 25 Y= 50 for a North or South vertically drawn needle) and each with an opposing end central axis point of 13 pixels (halfway point of 25 pixels), then the following Position= and Axis X/Y values should be true as follows below if properly set and oriented on their true Cardinal headings of North, South, East, West as referenced in each Position = example below. I've set the Axis for each at the very tail end of the needles (which all meet in the middle of the drawing) as they are essentially 13, 1 or 1, 13 for East and South but would be very different for West and North as discussed earlier. I also realize that many people give their needles more of a "tail" for some reason and imbed the axis point deeper into the bed of the graphic but for ease of understanding and illustration I just set the axis out at the very end.
A final note to remember here that may help some people is to always draw a needle graphics longitudinal width with an odd number... 21, 23, 25, 27, 29 and so on because you need a central longitudinal axis on which to pivot with two equal even number of pixels on each side. A needles total length can be even but its width which determines the longitudinal axis and pivot point for rotation should be odd, hence we are using 25 in this case with 13 being the central axis line (12+1+12) or 13 from either side.
NORTH NEEDLE (red)
Main Image: 100 x 100
Needle Bitmap of: X=25 Y=50
Variable code of: PointsTo=North
Code is then:
<Position= X="38" Y="0" /> (here X is half of the vertical needle's axis thickness thus 50 pixel (middle of 100x100 base image minus 12 and Y = 0 because its set at the very top)
<Axis X="13" Y="49"/>
SOUTH NEEDLE (yellow)
Main Image: 100 x 100
Needle Bitmap of: X=25 Y=50
Variable code of: PointsTo=South
Code is then:
<Position= X="38" Y="50" /> (here X is also 50 - 12 to keep the needle axis on the 100x100 images centerline and the Y begins on the halfway mark of the 100x100 image)
<Axis X="13" Y="1"/>
EAST NEEDLE (green)
Main Image: 100 x 100
Needle Bitmap of: X=50 Y=25
Variable code of: PointsTo=East
Code is then:
<Position= X="50" Y="38" /> (here X is the 100x100 halfway mark but the top edge of the needle begins at 38 pixel down from top to keep the center axis on the 50,50 center point)
<Axis X="1" Y="13"/>
WEST NEEDLE (blue)
Main Image: 100 x 100
Needle Bitmap of: X=50 Y=25
Variable code of: PointsTo=West
Code is then:
<Position= X="0" Y=38" /> (here X is zero because its' top left half begins on the far left side of the 100x100 image and Y is 38 down as before to set the needle's axis line right on the 50,50 centerline of the background image)
<Axis X="49" Y="13"/>
Providing I am correct with all my assessments, these are the four primary calculations, correlations, and relationships to be used whenever coding any of the four primary needle positions. Take notice that the Bitmap X/Y values simply flip when using North/South vs East/West and that the Axis values are all very different as discussed earlier, especially with the West needle having a high X axis value and North needle having a high Y axis value simply because the axis is set on the far opposite end of the Positioning (Position=) locations. These can help serve as reminders to check that the ratios of whatever you're working on will follow a similar relationship.
Other things to possibly discuss in this thread are the few odd scenarios where you have non-standard counter-clockwise movement or may have for example an East needle that needs to move clockwise (up to down) or a west needle that needs to move counter-clockwise (up to down), or south needle that needs to move right to left or north needle that needs to move right to left but I think those are extremely rare cases and maybe this is where you just need to flip the ascending/descending order of the Item Value = in the Nonlinearity tables to get opposing movements. At least I think that's how it's done. Hopefully some pro's will chime in at some point on this essay.
Now let's move on to what makes the needles actually move:...the Nonlinearity Table.
With the Nonlinearity table you have three styles of movement to tell a needle or other objects how to move. These are an X/Y Coordinate System (very common for needle movements), a Percentage System (more common to full rotation gauges), and a Radians System. I won't go into how all three work and will just use the defacto X/Y coordinates for quick example purposes since that seems to be the majority of what people use, especially for needle movements.
On the code line above a Nonlinearity table is the Value line. Here you first assign a Minimum and Maximum value for your gauge Element and this determines the two far extremes of how the gauge will move whether it be in a quantity of something like fuel gallons, fuel percentage, fuel pressure, engine torque, cylinder head temperature, etc. Therefore the Minimum and Maximum values are an expression of what your variable limits will be. This could be Value Minimum="0" Maximum="100" or could be 0/1000 or even 1/10000 and will always depend on the variable in use that is listed right after the value range itself. I assume this is fairly understood by most and there are plenty of other tutorials to explore on this subject so I won't go into it further. Regardless, once that value range is established, you then apply it to your nonlinearity table.
So a value data set could look like this:
Descending value percentage order from 100 to 0 indicating a needle set on a left side or center of a gauge dial with needle pointing East..
<Item Value="100" X="141" Y="124"/>
<Item Value="50" X="136" Y="173"/>
<Item Value="0" X="113" Y="217"/>
Ascending value percentage order from 0 to 100 indicating a needle set on a right side or center of a gauge dial with needle pointing West..
<Item Value="0" X="188" Y="216"/>
<Item Value="50" X="161" Y="172"/>
<Item Value="100" X="156" Y="123"/>
As I understand it, you really only need two values in most cases that provide the minimum range (typically Item Value="0") and the maximum range (typically Item Value="100" or 1000, 10000, etc) and do not need to include a lot of other various X/Y needle placement value coordinates in between to mark every single position on the gauge as the simulator itself knows what to do once the two value extremes are given along with the point of rotation. So for these examples, given you have properly set the minimum / maximum value ranges, a needle should be able to show 10%, 25%, 50%.. (or any other percent or value in-between the min/max value ranges) as needed without you having to manually enter and code each one. This too has been confusing to me as I often see some people have only registered the minimum and maximum values while other times people will register every other point, or maybe the start, middle, and end (3 points as I illustrated above). So the confusion created is that there never seems to be a defined or definitive standard in use between coder... No code for code if you will and so this is really confusing for those of us in our infancy of XML. My point here is that if you typically only need two item values for the min./max. then this obviously leaves a lot less work to do in the nonlinearity table for gauge needles.
I think that's enough for now. I really want to hear people's inputs on all this and if this egg is cracked or needs more baking. I just want to understand this once and for all!
Currently, I'm a little confused about XML needle points and what to use, particularly when you have a needle that may need to point West or North (or really anything other than East and also anything that requires counter-clockwise movement). I see many gauges that seem to only use "PointsTo=East" for everything and nothing else which adds to the confusion when there are three other directions available and seemingly should be in use much more from a more intuitive standpoint. I would also think west pointing needles which move clockwise would actually be most common but I haven't found many. So I'm wondering why is that? Is overuse of East pointing needles and the PointsTo=East command just an "easy way out" coding habit that works for a lot of directions simply because it's what people have copied from one another over the last 20 years or are there actually more "proper" ways to do these things? Why don't I ever see the other 3 cardinal directions in use with their coding reflecting that use!?
I'm hoping to get to the bottom of this once and for all as I have only found 4 or 5 older threads and while they give some code examples the main issue for me is none of them ever teach the HOWs and WHYs to allow you to really understand the full process of needle pointing. Every time I come back to it I quickly glaze over staring at code examples, especially when I can't mentally connect the how and why something works in one way but not another that seems so similar. I want to also preface this by saying this theory that I'm about to dive into might not be status quo or fully correct, but I think it is and I think you are going to easily see what I'm getting at and how this should actually be intuitive in its application.
I also get that the coding in the nonlinearity table always reflects clockwise movement and that the table can be reversed to change things or change direction but that is not my only issue and I really want to take a logical stab at analyzing this from the top down.
So let's begin;
As I understand it, you should first create a needle bitmap graphic in whatever physical orientation that will most closely reflect its intended movement. That would of course make the most logical sense. However, I often see many gauges where people DO NOT do this which I can only assume is to save a little time and use just one needle image per gauge instead of two, or three or more. The issue with that for me is it becomes very confusing when trying to learn to code. Regardless, if using more than one needle for purposes of better coding, and for better purposes of intuition and illustration, I have to assume that if doing so, you would also want the PointsTo= command variable to reflect that same exact orientation. Thus any vertical graphic with the needle point set on top (0 degrees / north) should intuitively be created for a needle that when in use will mainly point up and would primarily use some portion of the top semi-circle of a gauge dial. And so in this case you would similarly intend to use a PointsTo=North command in the XML code. (see the included drawing example I made to follow along). I think I've read elsewhere that this is how to start.
As as example, a north pointing needle may have its Nonlinearity table set to start on the left side of a gauge, let's say 270 degrees left (for zero percent fuel or zero gallons, zero amps, etc) and then end at 90 degrees right (for 100 percent fuel or x-full gallons, etc) I would assume that you would want to use a needle graphic and "PointsTo" that is always somewhere in between your two extremes and not fully to one side or the other. Even though I suppose it could work I don't think it would make sense to use one extreme or the other (such as east or west) Regardless, if just using an East needle graphic for everything then assumably you could also just use a West facing needle graphic too for the same purpose.
Once again, it seems a lot of coders often use East exclusively and so I just want to know why that is unless all gauges typically tend to be able to use that assignment. As I discuss below, West and North needles are intuitively more cumbersome to figure out, but if we can demystify their use then maybe it will no longer appear that way for myself and others who are now looking towards the longer term of FS gauge coding now that we have a new sim this year. Regardless, and in efforts of common sense and intuition, you would think you would always want to use one that best represents your midpoint between the two value range extremes and never one that is on either extreme or very close to it. Regardless, after reading various posts on this topic, many of which go unanswered, this topic seems to be something most people struggle with. I made a graphic that is attached which you can follow along with.
So let's assume the following four things are most often true for the 4 possible needle orientations of North, ..South, ..East or ..West:
A -- a vertical (North) pointing needle will most likely need to sweep from approximately 270 degrees left or west to 90 right or east in a CLOCKWISE fashion, thus fully sweeping left to right like the speedometer in your car.
B -- a South pointing needle would need to do the same from 270 left to 90 right but in a COUNTER-clockwise direction sweeping at the bottom of a semi-circular arc moving left to right. (I assume this is a rare use in FS)
C -- an East pointing needle would generally sweep up from 180 degrees south (for empty, off, zero fuel, etc,) to 0 north (full, on, 100%, etc) thus moving in a COUNTER-clockwise direction.
D -- a West pointing needle would need to visually point west and sweeps from 180 degrees south to 0 north in a CLOCKWISE direction like a North needle does.
So in these four scenarios, we have two needles (A-North and D-West) that move CLOCKWISE and two needles (B-South and C-East )that move in a COUNTER-clockwise direction. I think these are the only four possibilities you will ever encounter.
They all overlap each other of course (90 degrees each side of their cardinal heading) but if you mentally assign each one a 180-degree arc movement then this all makes for logical illustration as to which is best to use for your coding needs.
*Note: A caveat here is this is not (yet) discussing needle movements which may require full 360 rotation like an Altimeter, Airspeed Indicator, ADF, RMI, etc... only gauge needles with a limited sweep of 220 degrees or less and most commonly 180 or less.
Based on those four assumptions I assume most everyone will have the greatest troubles understanding the next two scenarios below because of their non-intuitive positioning (Position=) in relation to the axis of rotation <Axis X= Y= />.
For this example; Let's say you have a needle that when the graphic is drawn East or West both are X=50 Y=25. And when the graphic is drawn vertically for a North or South orientation the values are both now X=25 and Y=50 (thus opposite).
So the big difference here between all four is their Position= values (i.e; coordinates). These will all be very different if you always have to position and reference each one of them from the Top Left corner of the graphic bitmap.
Now let's look at the two which are most confusing and least intuitive;
Scenario 1 -- A West needle. -- If you have a needle that needs to primarily face west and sweeps from "0/empty" at 180 deg. south up to 0 deg. north, how is it coded using a bitmap that is also graphically drawn pointing west???
Scenario 2 -- A North needle. -- If you have a needle that needs to primarily face north and sweeps from "0/empty" from a 270 west position a to 90 degrees east. How is it coded using a bitmap that is also graphically drawn pointing north???
Why these two particular scenarios are much more confusing than an East or South needle is because if you must always use the top left corner of the needle bitmap for its Position= coordinates in relation to the main bitmap it sits on, it means the axis of rotation for these two needles in particular will always be on the far opposite end from where you are anchoring them with the Position=. So this means the Position point and axis point are on far opposite ends from one another and in turn requires a lot more "careful math" to properly calculate and place the axis reference point of these two needle types. What may have been only counting 15 or 20 pixels with an East or South needle may become 50 to 60 or more with a North or West needle.
So with these two scenarios in particular it means the Axis' X value for needle rotation is now calculated at much longer of a distance away from the needle point than would be for any East or South pointing needle because with East / South the axis is always set much closer to the anchoring Position= point of the graphic. This is why I think people probably tend to just use East needles a lot. And here is where I'm even more confused is I swear I've seen instances of East, West, and North needles in use and the gauge works but the axis values are all the exact same... like X=10, Y=13 for example. I don't know how or why it works because it just doesn't make any sense. Logically speaking, and as I've just went to lengths to illustrate and explain, West and North needles should have a much greater axial X distance for horizontally drawn West needle bitmaps and a taller or longer axial Y distance for vertically drawn North needle bitmaps and the Axis section should always reflect that. Am I somehow wrong with this assumption? I don't think so but again, this is a head-scratcher that I haven't nailed down yet. I'll amend this document once I do.
If we assumed the two scenarios above are true then it will always mean any East and South needles (again.. both drawn that way and intentionally used and or positioned that way) will always have much smaller Axis X/Y values than any West or North needles because the axis points of all East / South needles will always be much closer to the point of orientation for the top left Position = coordinates and are therefore much easier to calculate very quickly. Again, this is my hunch why you see PointsTo=east with east drawn needles being used more than anything else.
Now let's look at a visual scenario of all these examples and explore how the above two West and North scenarios are coded, as well the two East and South that could be considered more common. (See attached image)
Given a base background bitmap of 100 x 100 with a central axis rotation point of 50,50 and a needle bitmap for all four cardinal headings with a size of X= 50 Y= 25 (or X= 25 Y= 50 for a North or South vertically drawn needle) and each with an opposing end central axis point of 13 pixels (halfway point of 25 pixels), then the following Position= and Axis X/Y values should be true as follows below if properly set and oriented on their true Cardinal headings of North, South, East, West as referenced in each Position = example below. I've set the Axis for each at the very tail end of the needles (which all meet in the middle of the drawing) as they are essentially 13, 1 or 1, 13 for East and South but would be very different for West and North as discussed earlier. I also realize that many people give their needles more of a "tail" for some reason and imbed the axis point deeper into the bed of the graphic but for ease of understanding and illustration I just set the axis out at the very end.
A final note to remember here that may help some people is to always draw a needle graphics longitudinal width with an odd number... 21, 23, 25, 27, 29 and so on because you need a central longitudinal axis on which to pivot with two equal even number of pixels on each side. A needles total length can be even but its width which determines the longitudinal axis and pivot point for rotation should be odd, hence we are using 25 in this case with 13 being the central axis line (12+1+12) or 13 from either side.
NORTH NEEDLE (red)
Main Image: 100 x 100
Needle Bitmap of: X=25 Y=50
Variable code of: PointsTo=North
Code is then:
<Position= X="38" Y="0" /> (here X is half of the vertical needle's axis thickness thus 50 pixel (middle of 100x100 base image minus 12 and Y = 0 because its set at the very top)
<Axis X="13" Y="49"/>
SOUTH NEEDLE (yellow)
Main Image: 100 x 100
Needle Bitmap of: X=25 Y=50
Variable code of: PointsTo=South
Code is then:
<Position= X="38" Y="50" /> (here X is also 50 - 12 to keep the needle axis on the 100x100 images centerline and the Y begins on the halfway mark of the 100x100 image)
<Axis X="13" Y="1"/>
EAST NEEDLE (green)
Main Image: 100 x 100
Needle Bitmap of: X=50 Y=25
Variable code of: PointsTo=East
Code is then:
<Position= X="50" Y="38" /> (here X is the 100x100 halfway mark but the top edge of the needle begins at 38 pixel down from top to keep the center axis on the 50,50 center point)
<Axis X="1" Y="13"/>
WEST NEEDLE (blue)
Main Image: 100 x 100
Needle Bitmap of: X=50 Y=25
Variable code of: PointsTo=West
Code is then:
<Position= X="0" Y=38" /> (here X is zero because its' top left half begins on the far left side of the 100x100 image and Y is 38 down as before to set the needle's axis line right on the 50,50 centerline of the background image)
<Axis X="49" Y="13"/>
Providing I am correct with all my assessments, these are the four primary calculations, correlations, and relationships to be used whenever coding any of the four primary needle positions. Take notice that the Bitmap X/Y values simply flip when using North/South vs East/West and that the Axis values are all very different as discussed earlier, especially with the West needle having a high X axis value and North needle having a high Y axis value simply because the axis is set on the far opposite end of the Positioning (Position=) locations. These can help serve as reminders to check that the ratios of whatever you're working on will follow a similar relationship.
Other things to possibly discuss in this thread are the few odd scenarios where you have non-standard counter-clockwise movement or may have for example an East needle that needs to move clockwise (up to down) or a west needle that needs to move counter-clockwise (up to down), or south needle that needs to move right to left or north needle that needs to move right to left but I think those are extremely rare cases and maybe this is where you just need to flip the ascending/descending order of the Item Value = in the Nonlinearity tables to get opposing movements. At least I think that's how it's done. Hopefully some pro's will chime in at some point on this essay.
Now let's move on to what makes the needles actually move:...the Nonlinearity Table.
With the Nonlinearity table you have three styles of movement to tell a needle or other objects how to move. These are an X/Y Coordinate System (very common for needle movements), a Percentage System (more common to full rotation gauges), and a Radians System. I won't go into how all three work and will just use the defacto X/Y coordinates for quick example purposes since that seems to be the majority of what people use, especially for needle movements.
On the code line above a Nonlinearity table is the Value line. Here you first assign a Minimum and Maximum value for your gauge Element and this determines the two far extremes of how the gauge will move whether it be in a quantity of something like fuel gallons, fuel percentage, fuel pressure, engine torque, cylinder head temperature, etc. Therefore the Minimum and Maximum values are an expression of what your variable limits will be. This could be Value Minimum="0" Maximum="100" or could be 0/1000 or even 1/10000 and will always depend on the variable in use that is listed right after the value range itself. I assume this is fairly understood by most and there are plenty of other tutorials to explore on this subject so I won't go into it further. Regardless, once that value range is established, you then apply it to your nonlinearity table.
So a value data set could look like this:
Descending value percentage order from 100 to 0 indicating a needle set on a left side or center of a gauge dial with needle pointing East..
<Item Value="100" X="141" Y="124"/>
<Item Value="50" X="136" Y="173"/>
<Item Value="0" X="113" Y="217"/>
Ascending value percentage order from 0 to 100 indicating a needle set on a right side or center of a gauge dial with needle pointing West..
<Item Value="0" X="188" Y="216"/>
<Item Value="50" X="161" Y="172"/>
<Item Value="100" X="156" Y="123"/>
As I understand it, you really only need two values in most cases that provide the minimum range (typically Item Value="0") and the maximum range (typically Item Value="100" or 1000, 10000, etc) and do not need to include a lot of other various X/Y needle placement value coordinates in between to mark every single position on the gauge as the simulator itself knows what to do once the two value extremes are given along with the point of rotation. So for these examples, given you have properly set the minimum / maximum value ranges, a needle should be able to show 10%, 25%, 50%.. (or any other percent or value in-between the min/max value ranges) as needed without you having to manually enter and code each one. This too has been confusing to me as I often see some people have only registered the minimum and maximum values while other times people will register every other point, or maybe the start, middle, and end (3 points as I illustrated above). So the confusion created is that there never seems to be a defined or definitive standard in use between coder... No code for code if you will and so this is really confusing for those of us in our infancy of XML. My point here is that if you typically only need two item values for the min./max. then this obviously leaves a lot less work to do in the nonlinearity table for gauge needles.
I think that's enough for now. I really want to hear people's inputs on all this and if this egg is cracked or needs more baking. I just want to understand this once and for all!
Attachments
Last edited:


") , has been corrected.
, has been corrected.

 That's bitten me on a few occasions, but OTOH I've also used it to my own advantage because occasionally the sim conversion does produce what I want better than my 8-bit images. It's also possible to use 32-bit images but it takes a long road to get there. Discussed here:
")
